Data
04.05.2026
Following our exploration of visual abstraction, this session shifts the focus from image to information. Instead of asking how much we can simplify what we see, we ask: how can something be described without being shown at all? We’ll look at what data is and how it is shaped by the way it is collected and structured. Where does data come from and what decisions are involved in defining it? Using simple examples and our own surroundings, we’ll begin to translate observations into data.
Data Types
What parameters and types of information can be used to describe a street? After collaboratively compiling a list of these characteristics, we tried to categorize them as either qualitative or quantitative data. In the process, we realized that this distinction is not always straightforward and that the boundaries between the two categories can often be quite fluid.
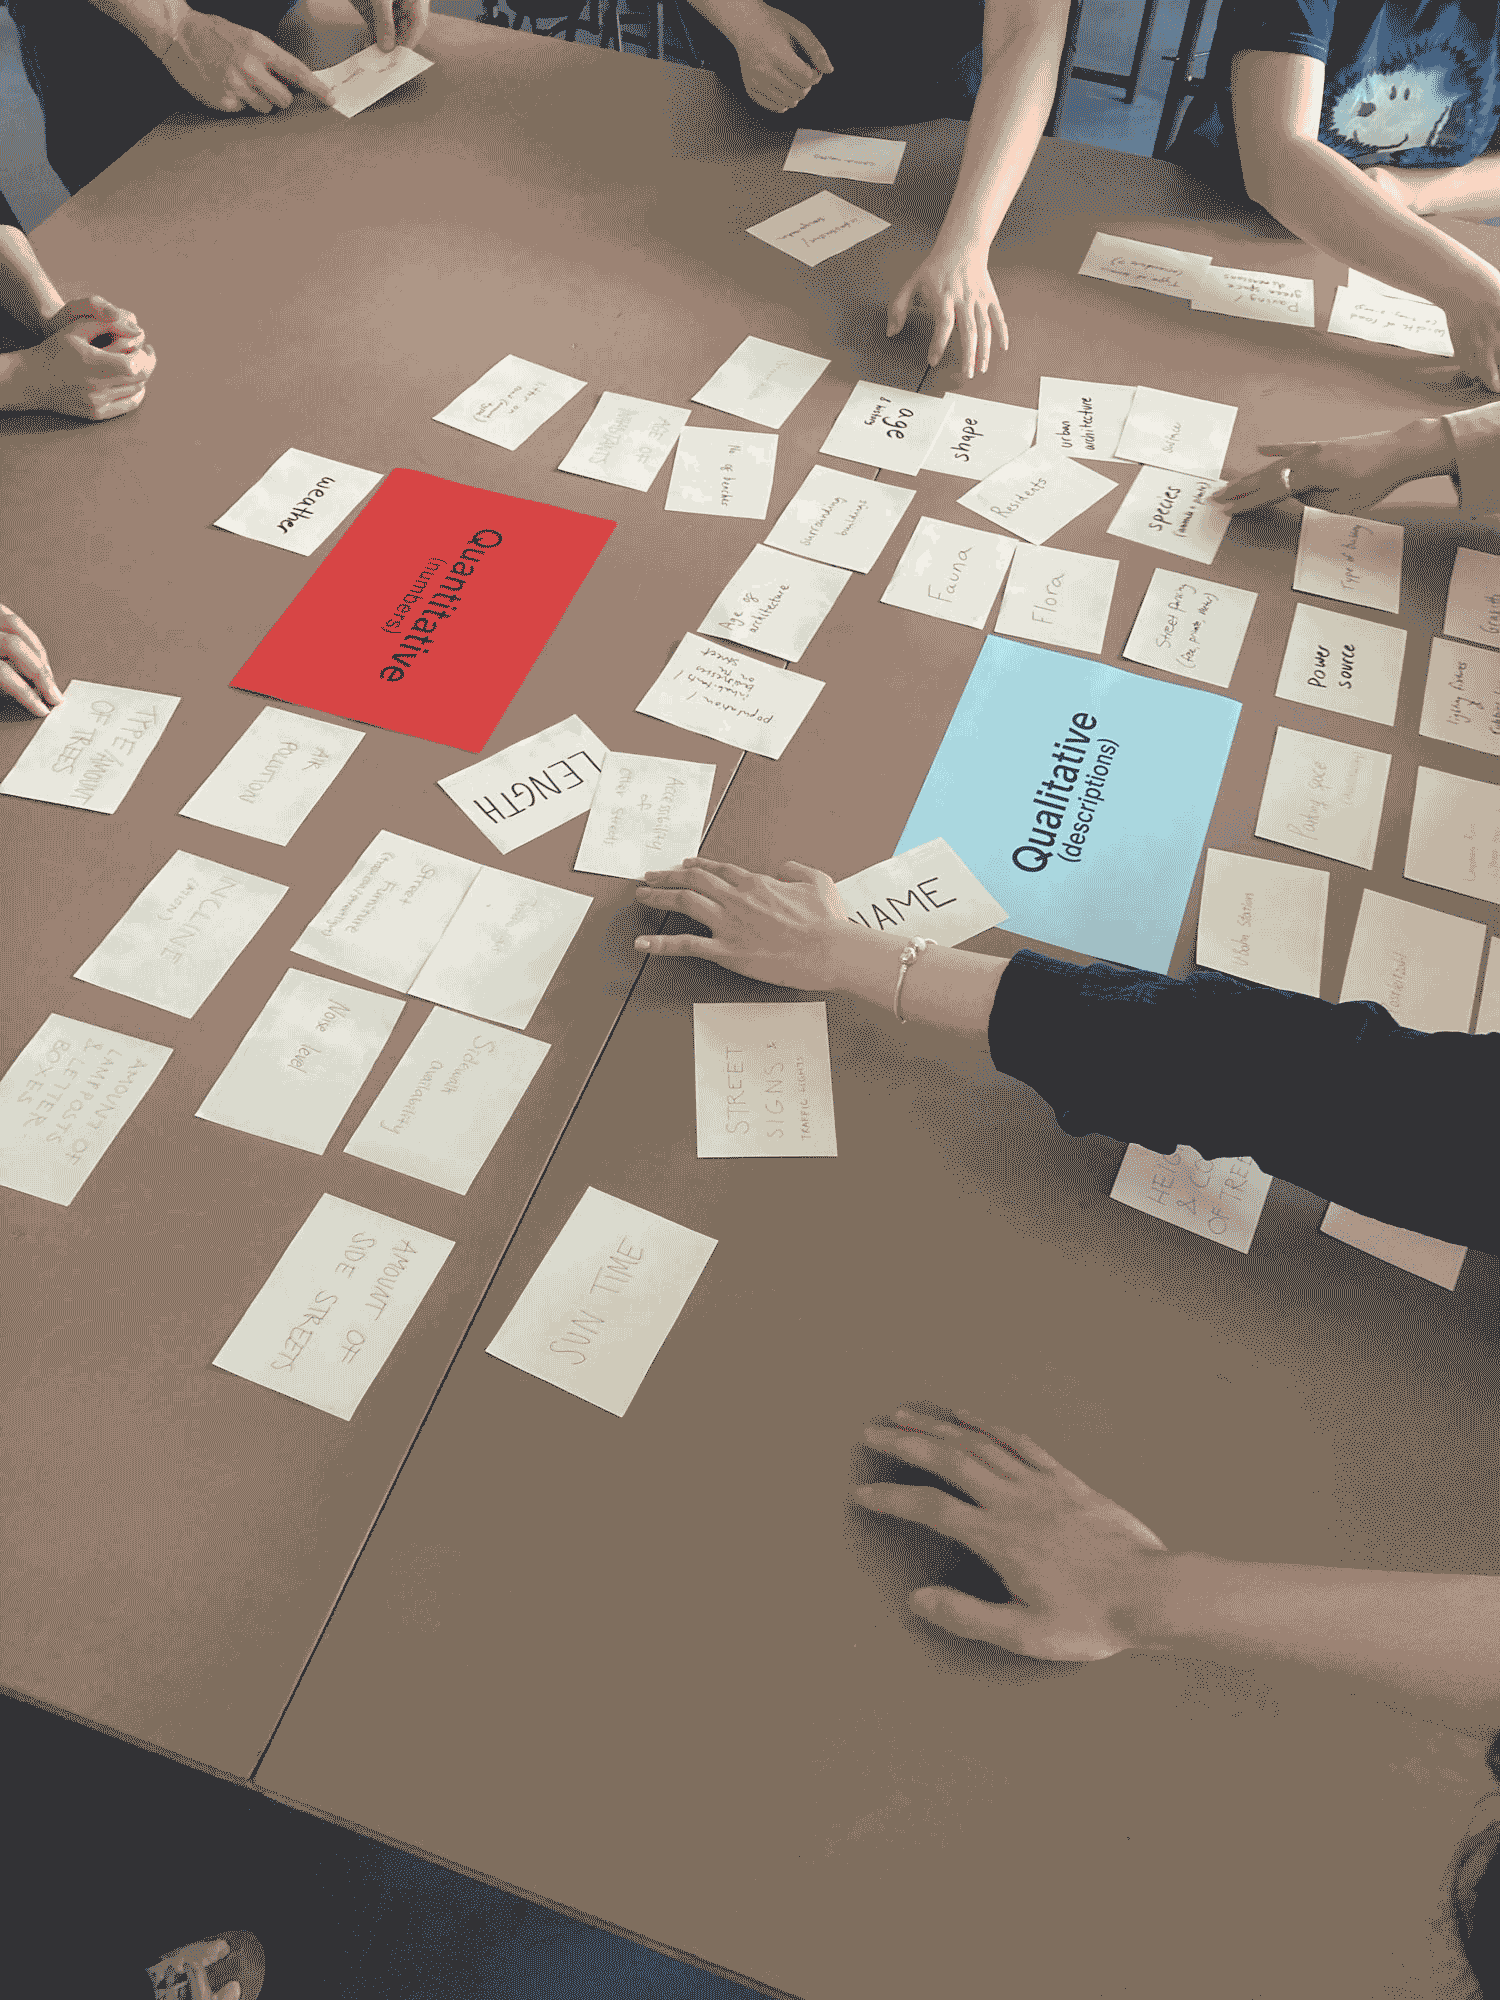
Data Sorting
Next, we explored different ways of sorting and organizing data. To do this, we applied Richard Saul Wurman’s LATCH method, which proposes five principles for organizing information: location, alphabet, time, category, and hierarchy.
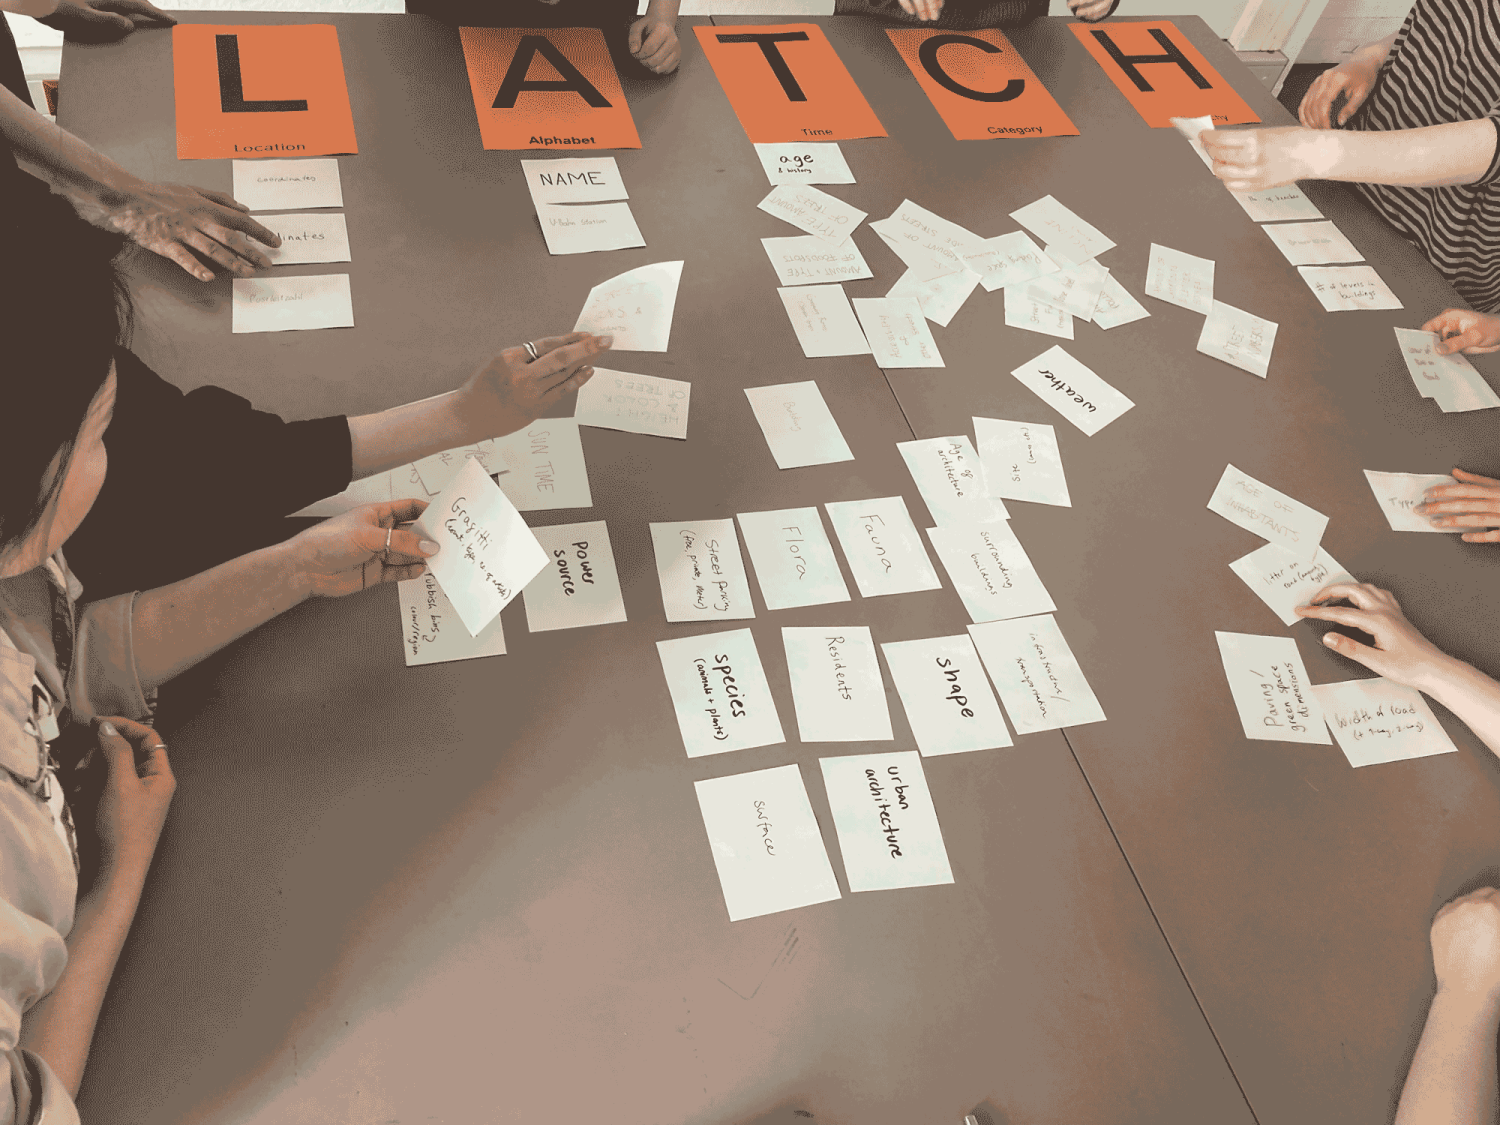

Street Data
From our list of parameters, the students selected ten that they want to use to describe the street where they live. To do this, they worked in a shared Google Sheet and filled in all the information. First, by doing some online research, any information that could not be found online was then investigated on-site.