Maps 2
22.06.2026
Last week, we explored how we perceive and represent places by creating mental maps with pen and paper. While these hand-drawn maps reveal personal experiences and spatial understanding, many design projects require working with actual geographic data. In todays session we will use QGIS to access data from OpenStreetMap, style the map and export it as an SVG file that can be further refined in Adobe Illustrator.
QGIS
QGIS is a free and open-source Geographic Information System (GIS) used to visualize, edit and analyze spatial data. Download and install the long term release version of QGIS from the official website. After installation, open QGIS and create a new project.
Adding a Basemap
When creating a new project, QGIS opens with an empty canvas. To get some orientation, it is helpful to add a basemap. In the Browser panel, expand XYZ Tiles and double-click OpenStreetMap. The map will be loaded into the project and displayed in the map canvas. If OpenStreetMap does not appear in your list, you can create a new basemap:
Right-click
XYZ Tilesand selectNew Connection.Enter a name for the connection (for example, OpenStreetMap).
In the URL field, paste the following address:
https://tile.openstreetmap.org/{z}/{x}/{y}.pngClick OK.
Double-click the new connection to add the basemap to your project.
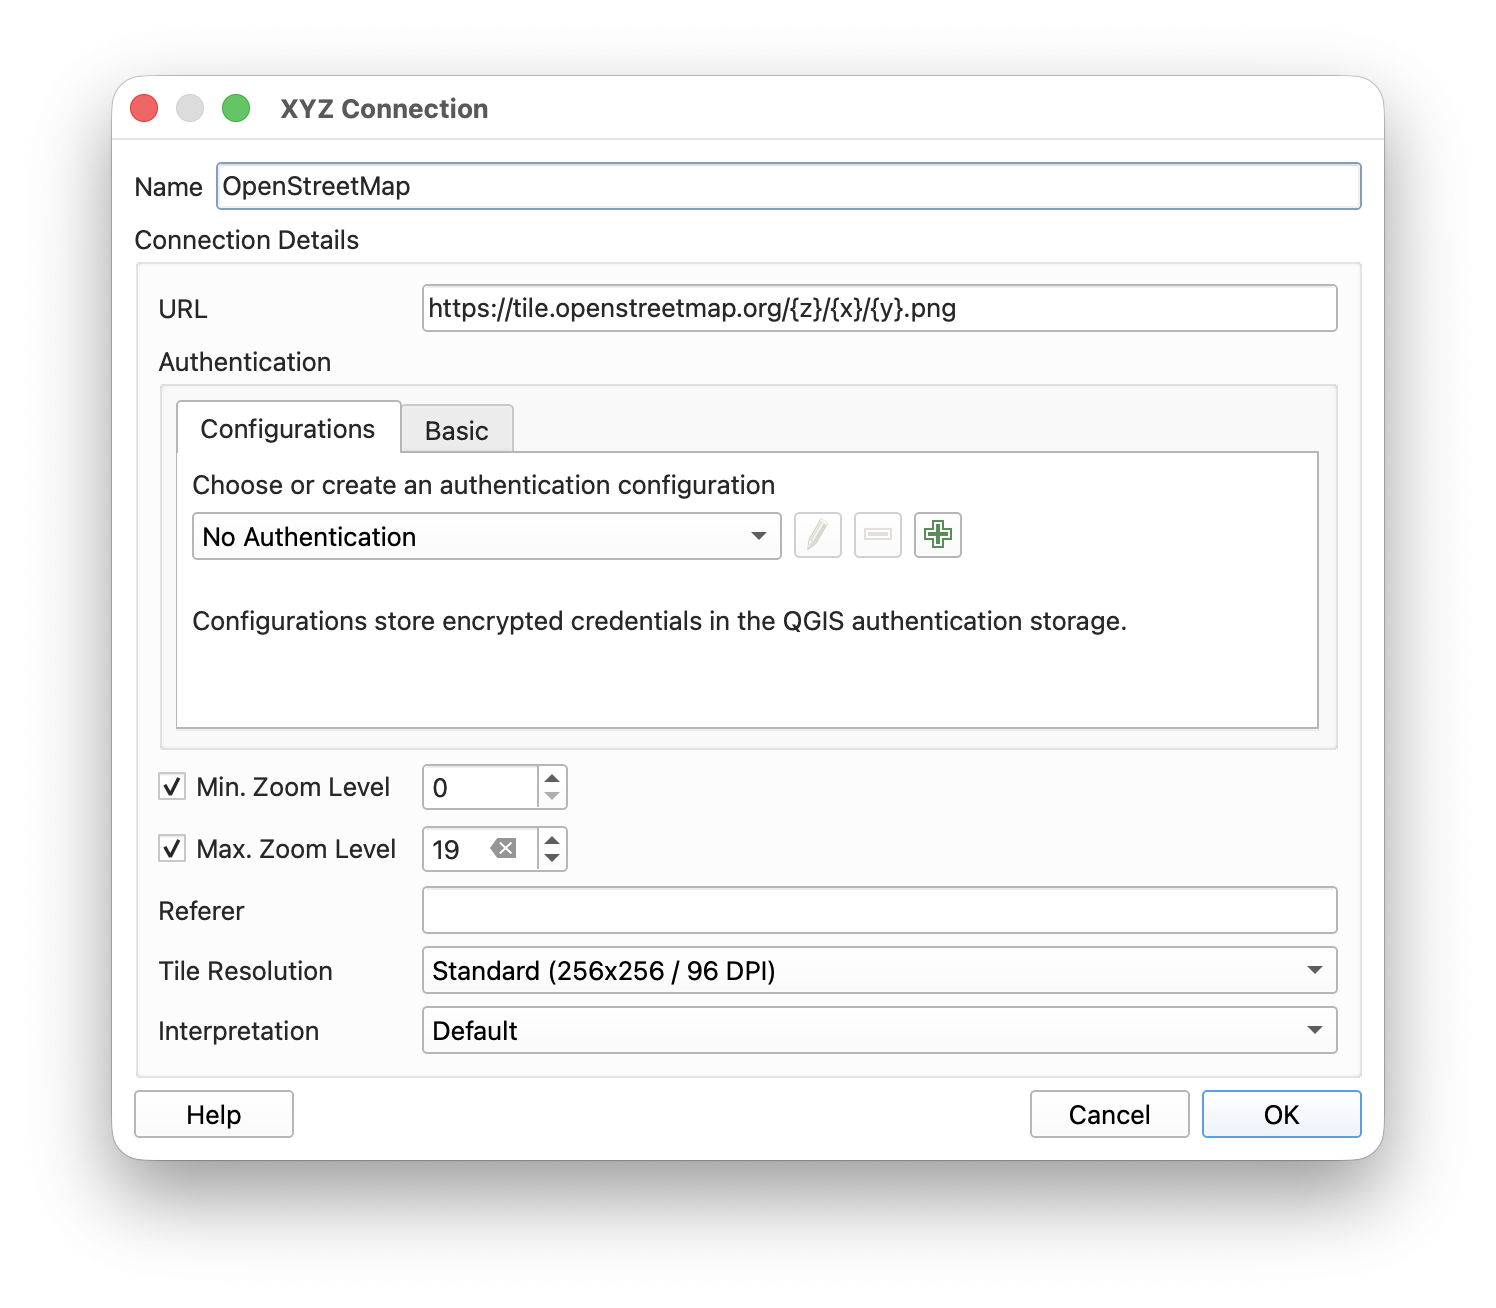
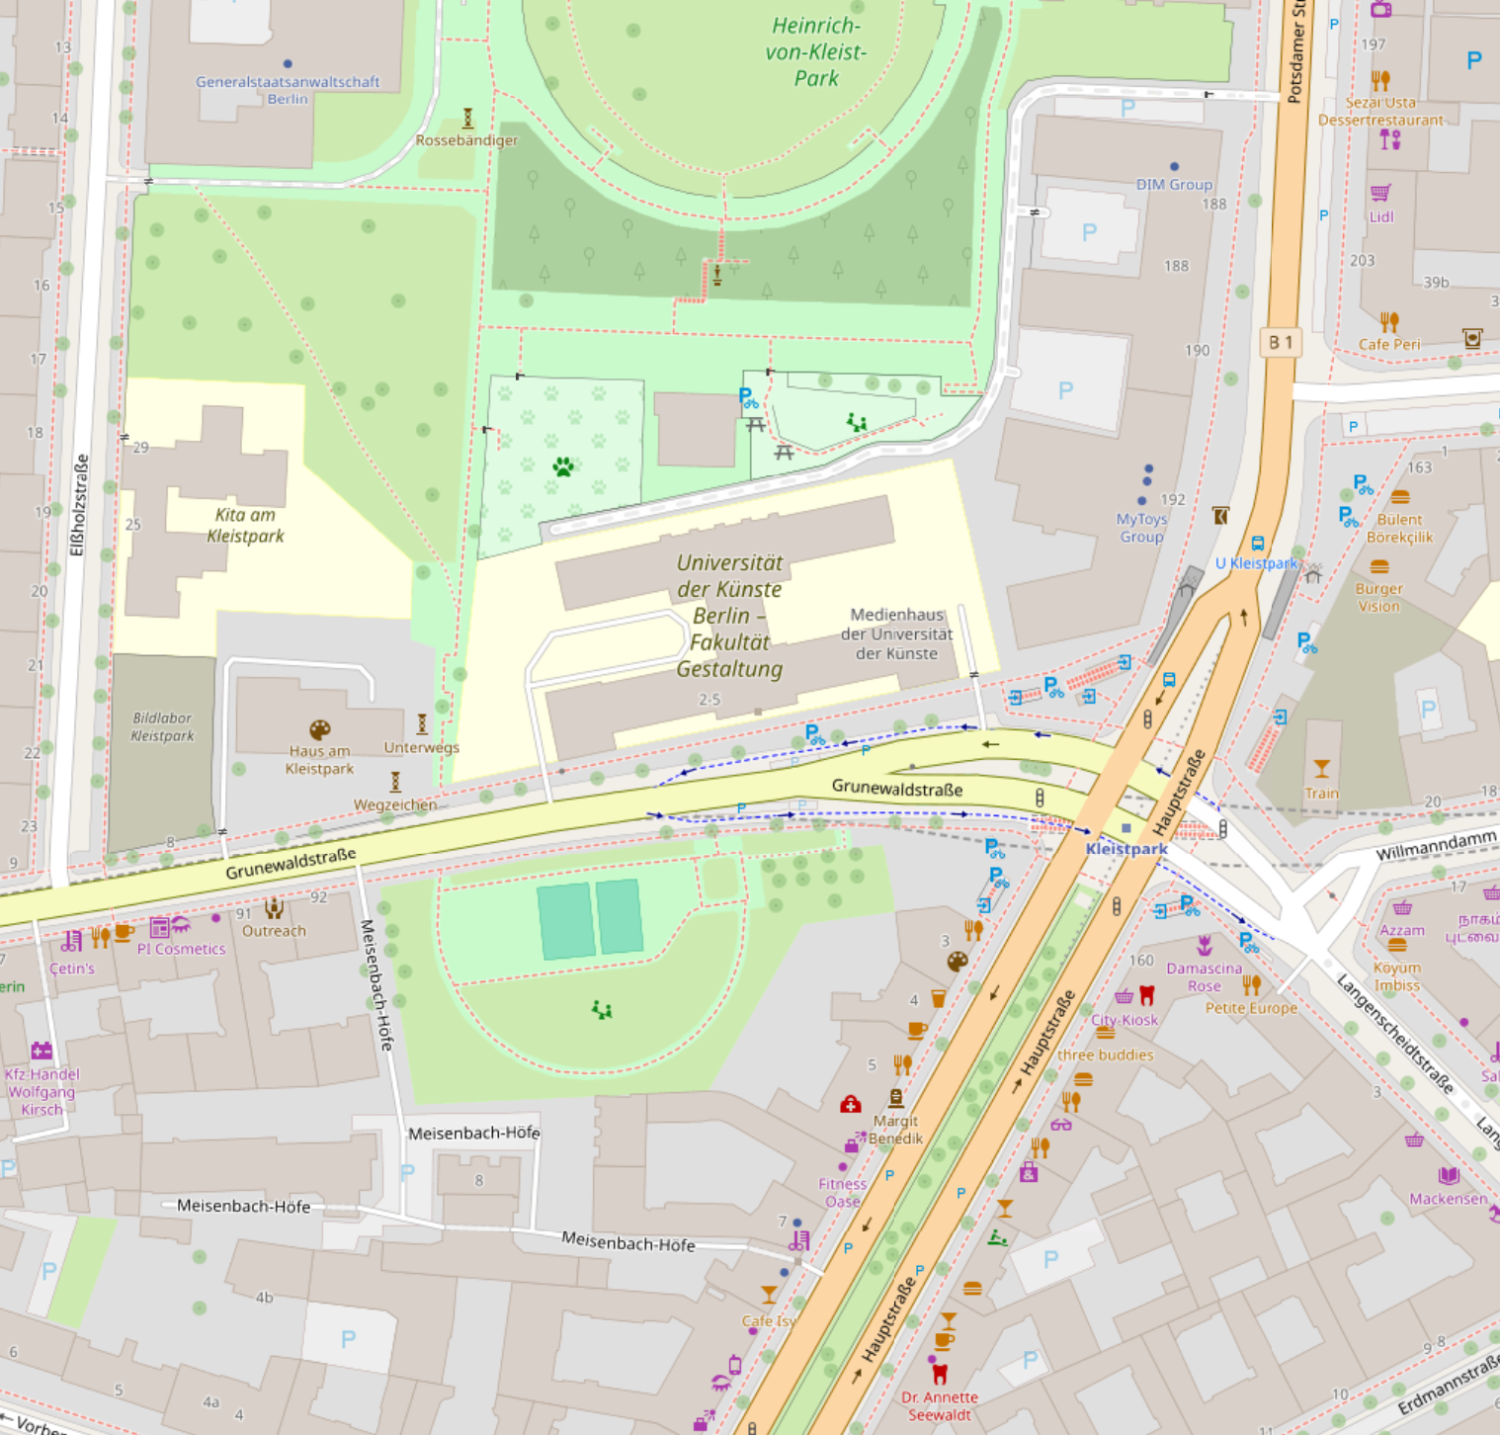
The basemap provides geographic context and helps you navigate to the area you want to work with. Since it consists of map tiles served online, it is mainly intended as a visual reference and will not be exported with your final vector map.
Geographic Data Types
Most geographic information can be represented using three basic geometry types: points, lines, and polygons. Points describe individual locations such as bus stops or landmarks. Lines represent linear features like roads, rivers, or railway tracks. Polygons are used for areas and surfaces, including buildings, parks, lakes, or administrative boundaries.
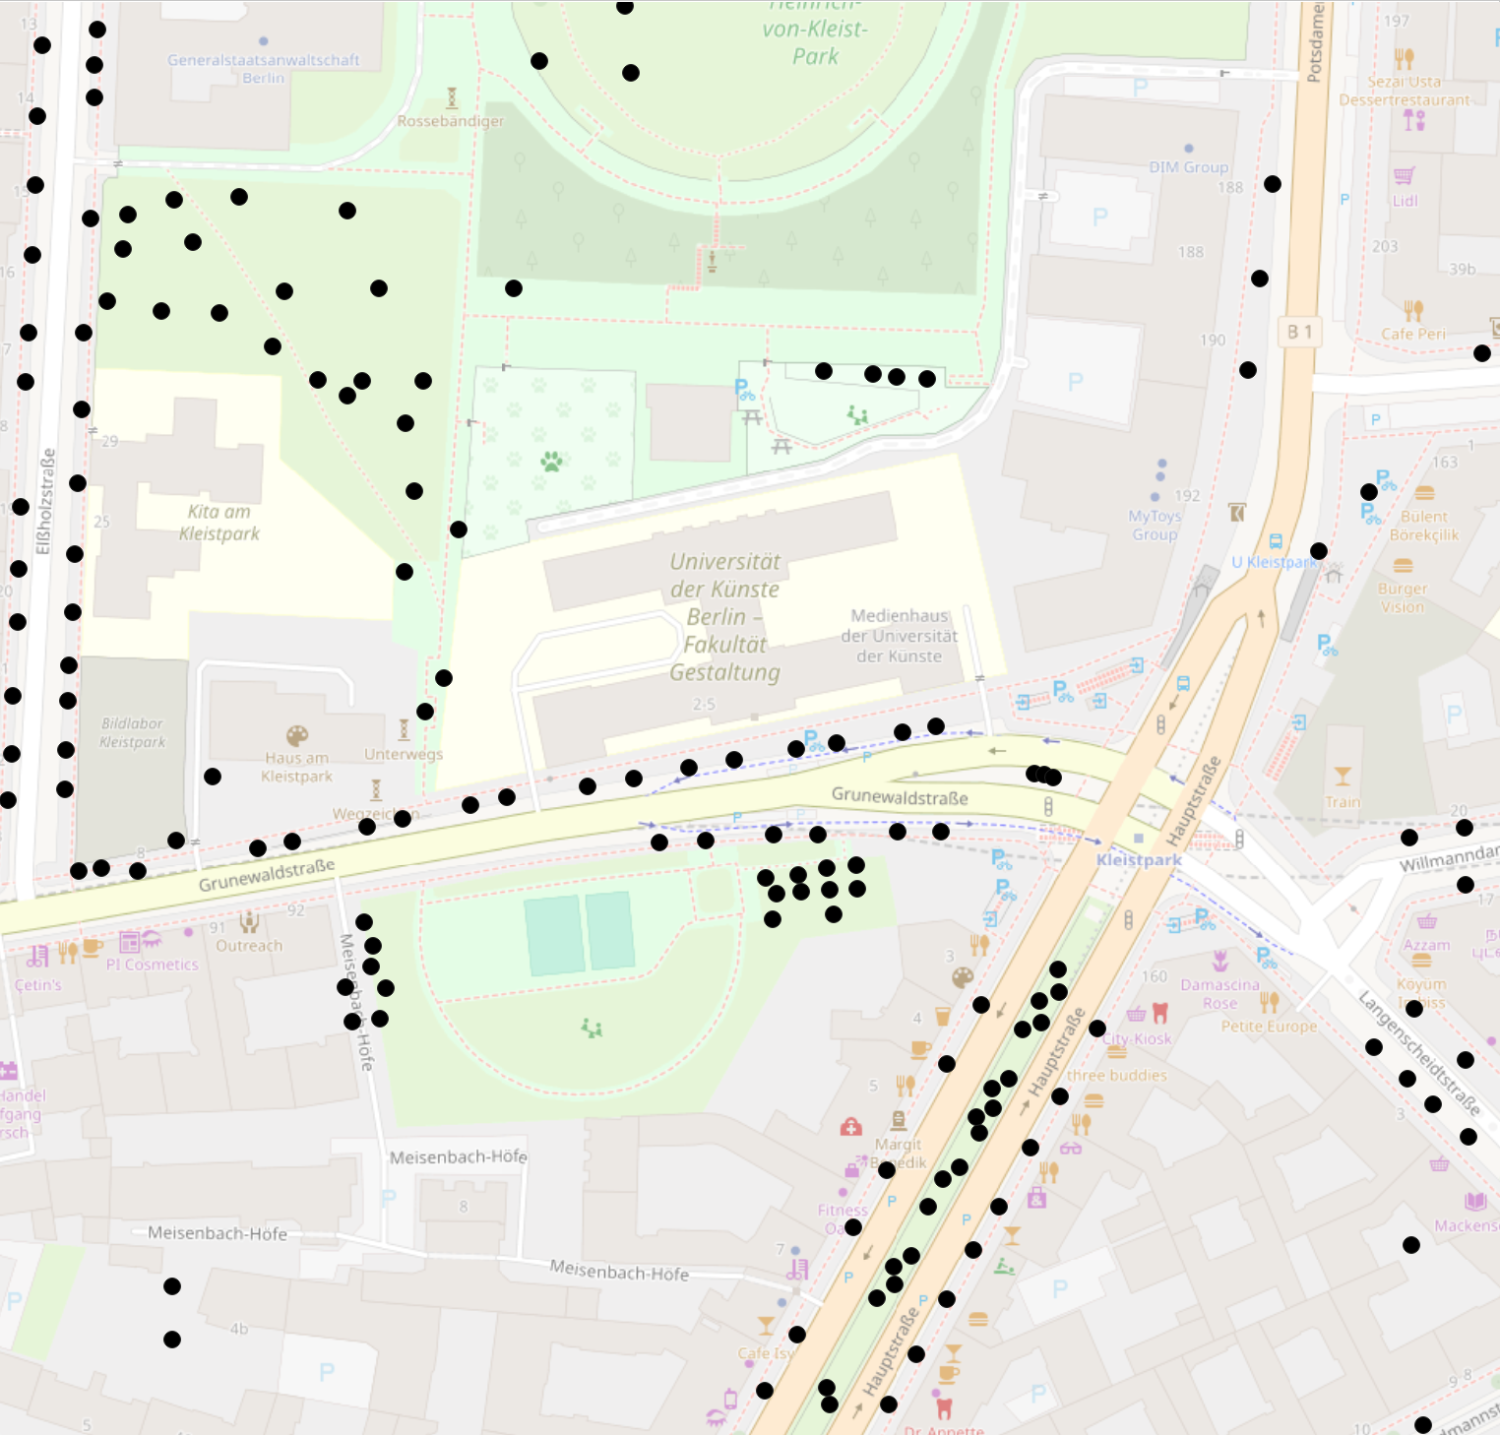
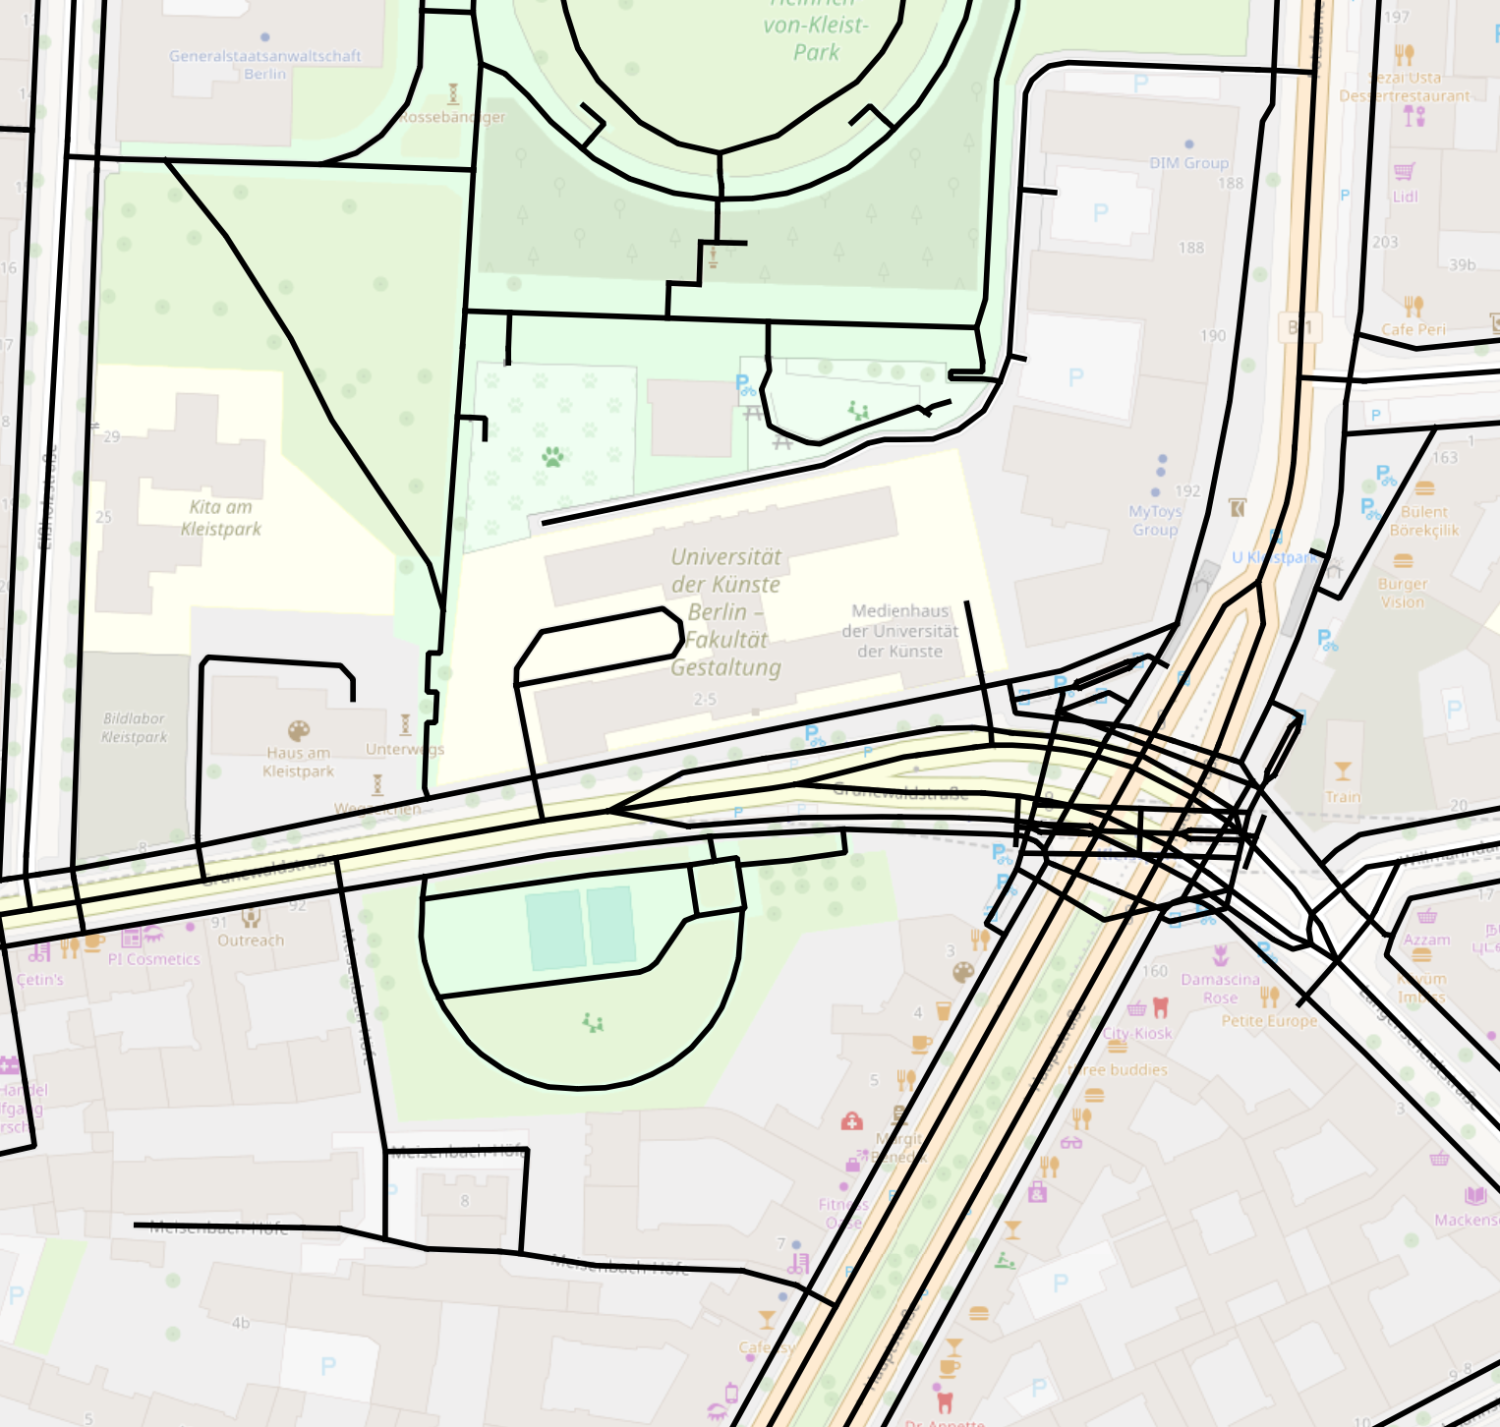
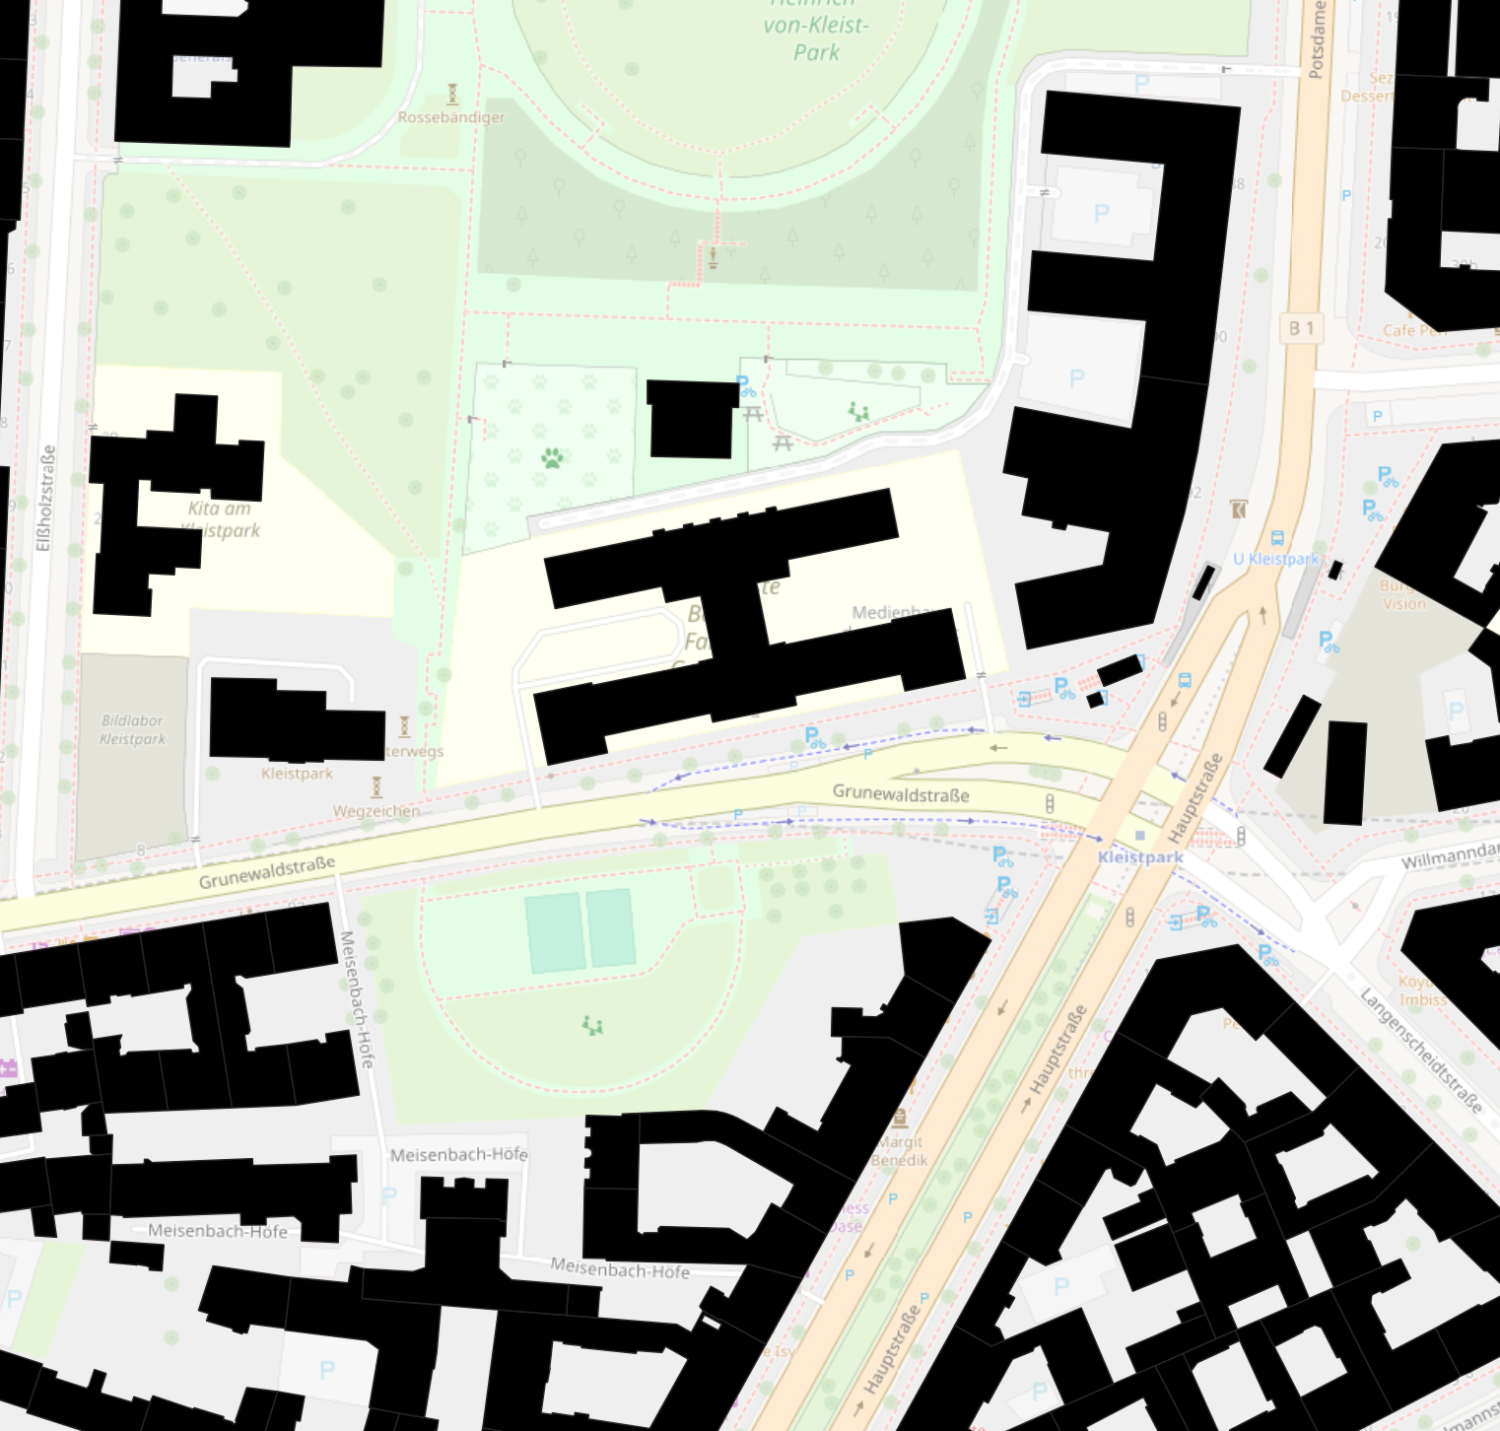
You can download the example datasets as GeoJSON files and simply drag and drop them into QGIS to load them directly into your project.
Loading Data with QuickOSM
QuickOSM is a plugin that allows you to download map features directly from OpenStreetMap.
Open
Plugins→Manage and Install PluginsSearch for QuickOSM
Click
Install PluginOpen
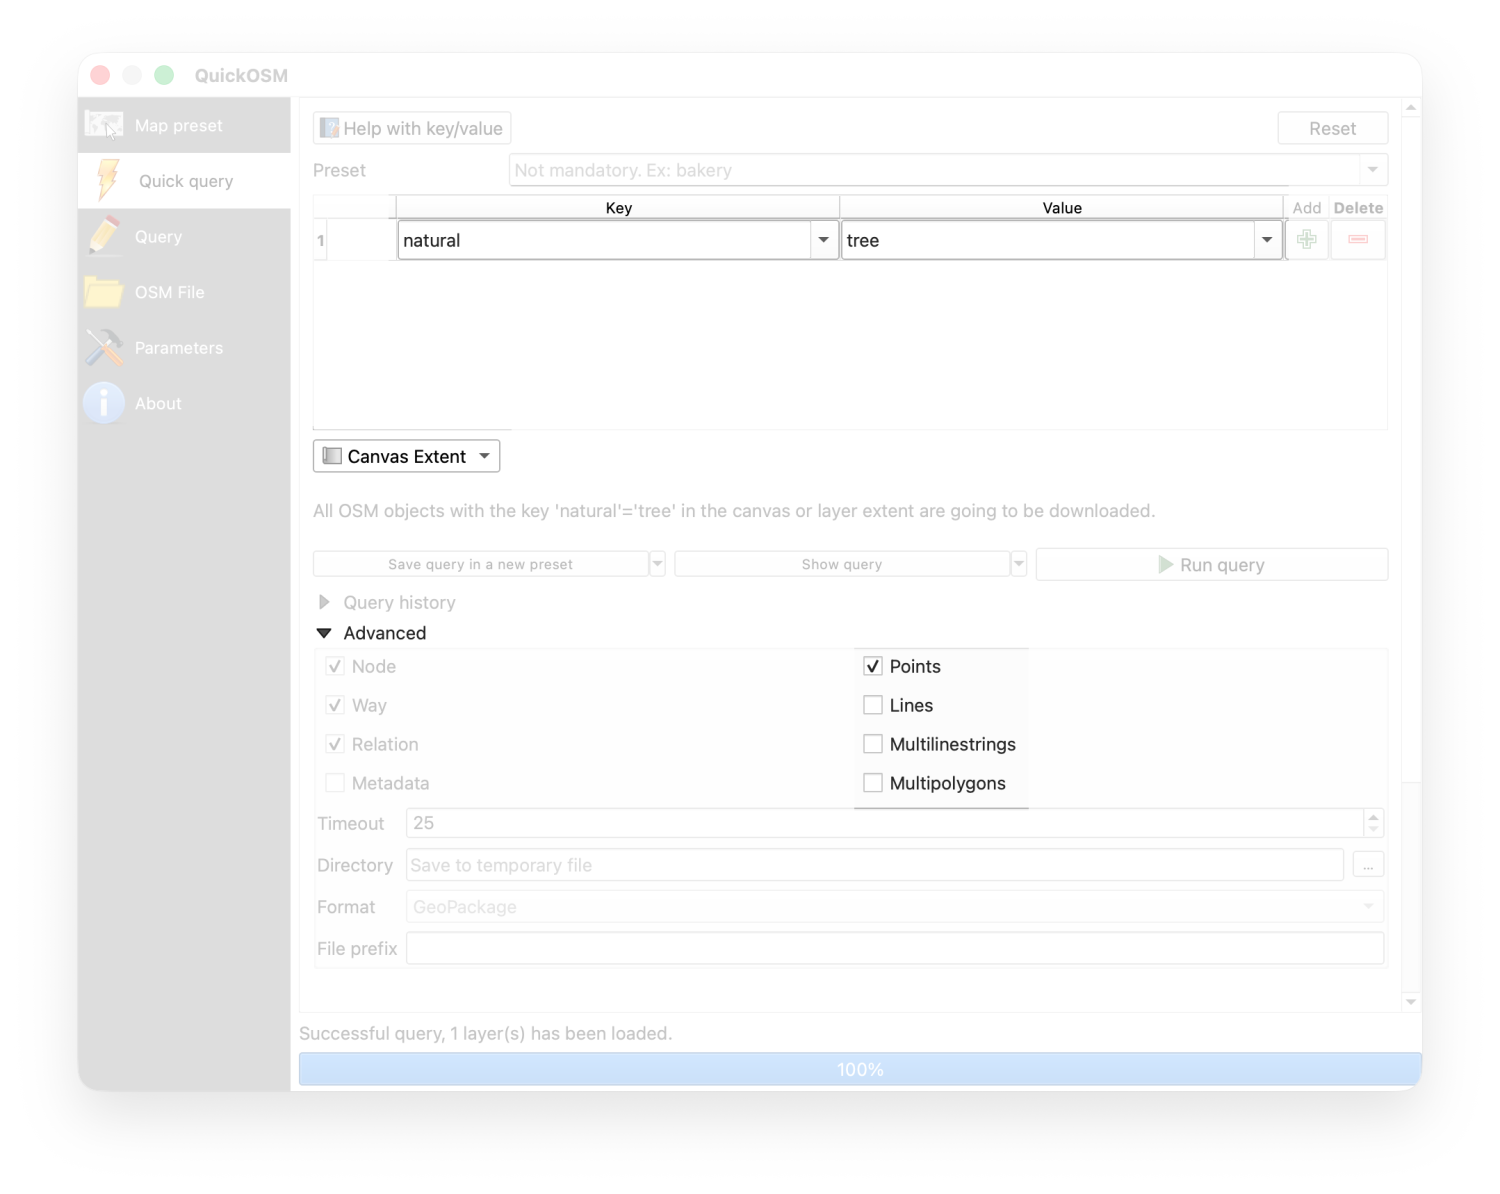
Vector→QuickOSM→QuickOSMTo perform a query, you need to define four important parameters:
Key
The category of the feature you want to retrieve (for example, highway, building, or natural).
Value
The specific type within that category (for example, primary, residential, or tree)
Geometry
Under the Advanced dropdown you can determine whether the results are returned as points, lines, or polygons
Area
Defines the geographic area for which the data should be downloaded (current map canvas, a selected layer or a place name like Berlin)
Error
Often QuickOSM queries can fail if the dataset is too large, for example when the area is too big or too many features are requested. In that case, reduce the area of interest or specify the features more precisely.
Keys and Values
For an extensive overview of available map features and tagging conventions, you can consult the OpenStreetMap Wiki. It provides a comprehensive list of all commonly used keys and values for different types of geographic data, which can help you refine your QuickOSM queries.
Attribute Table
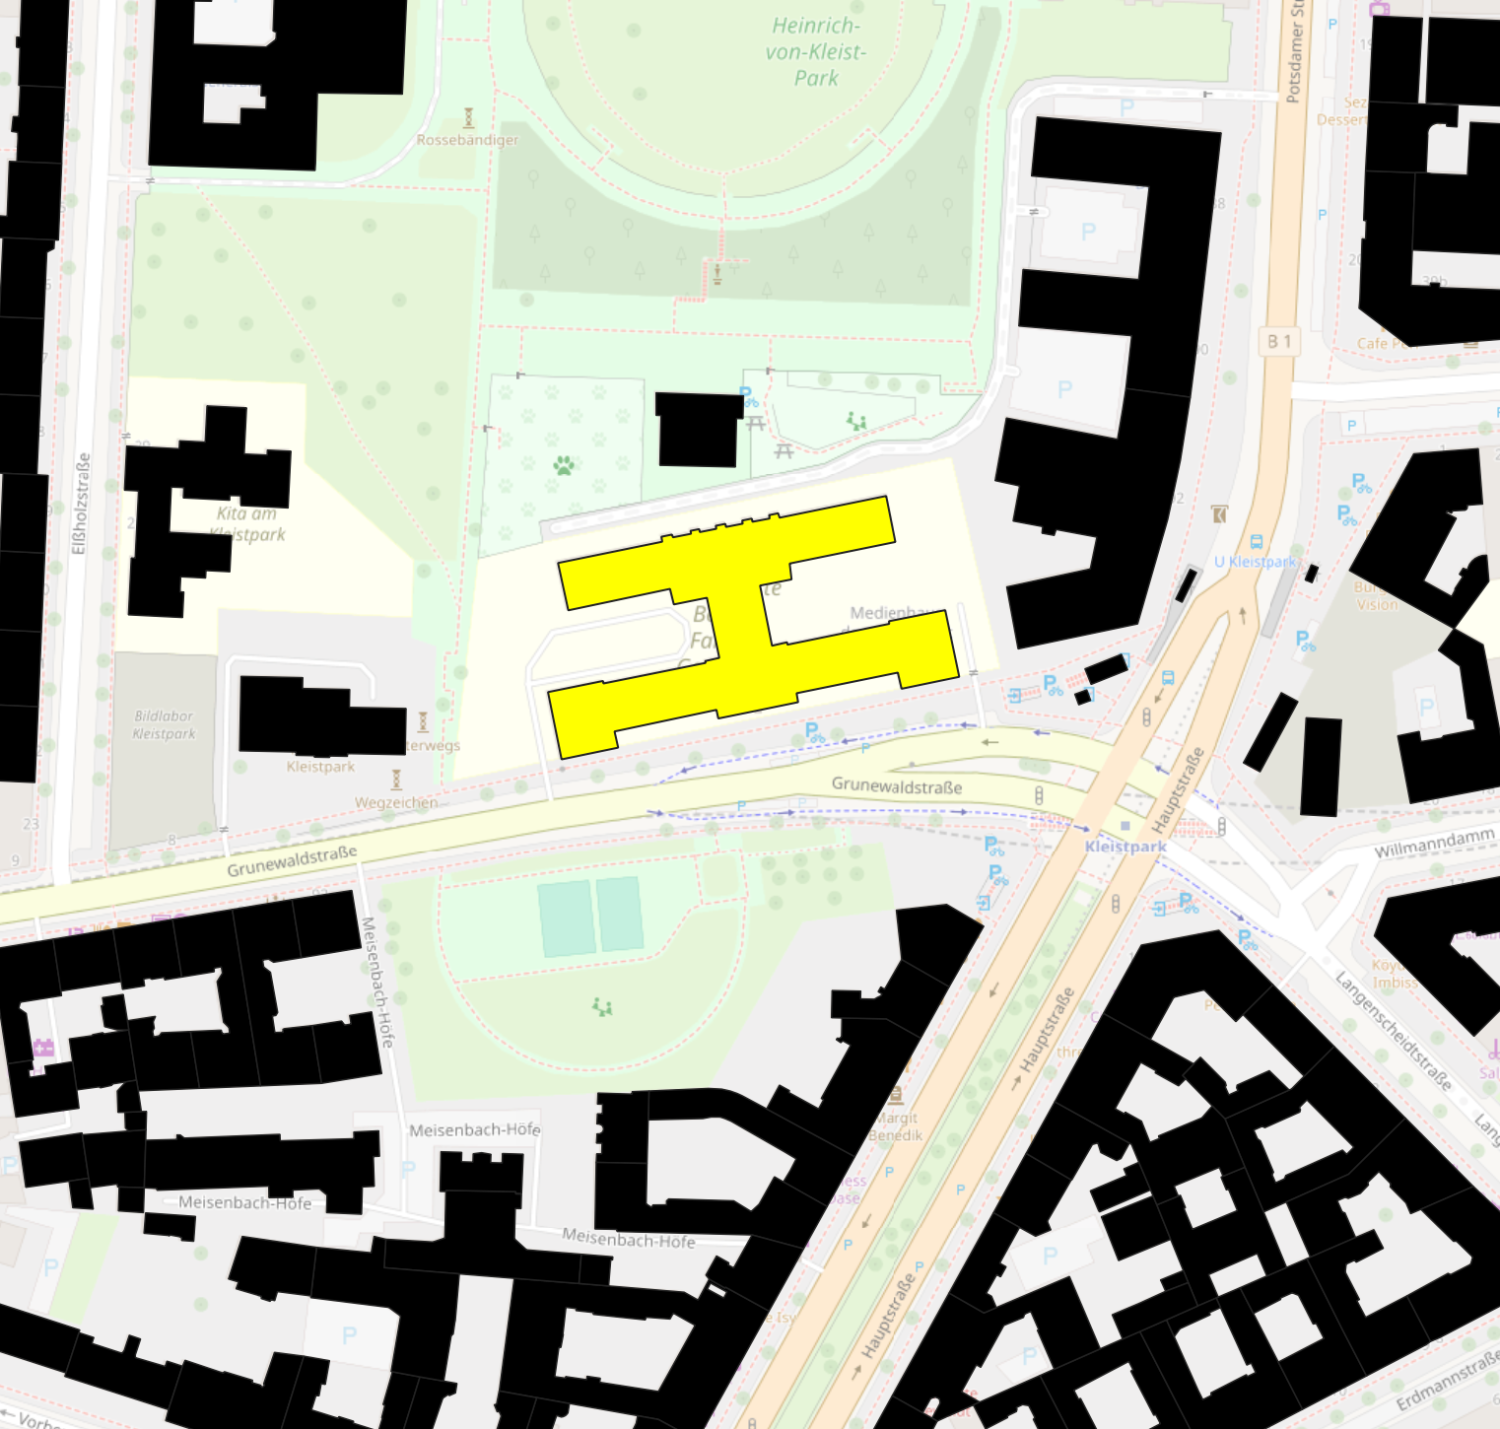
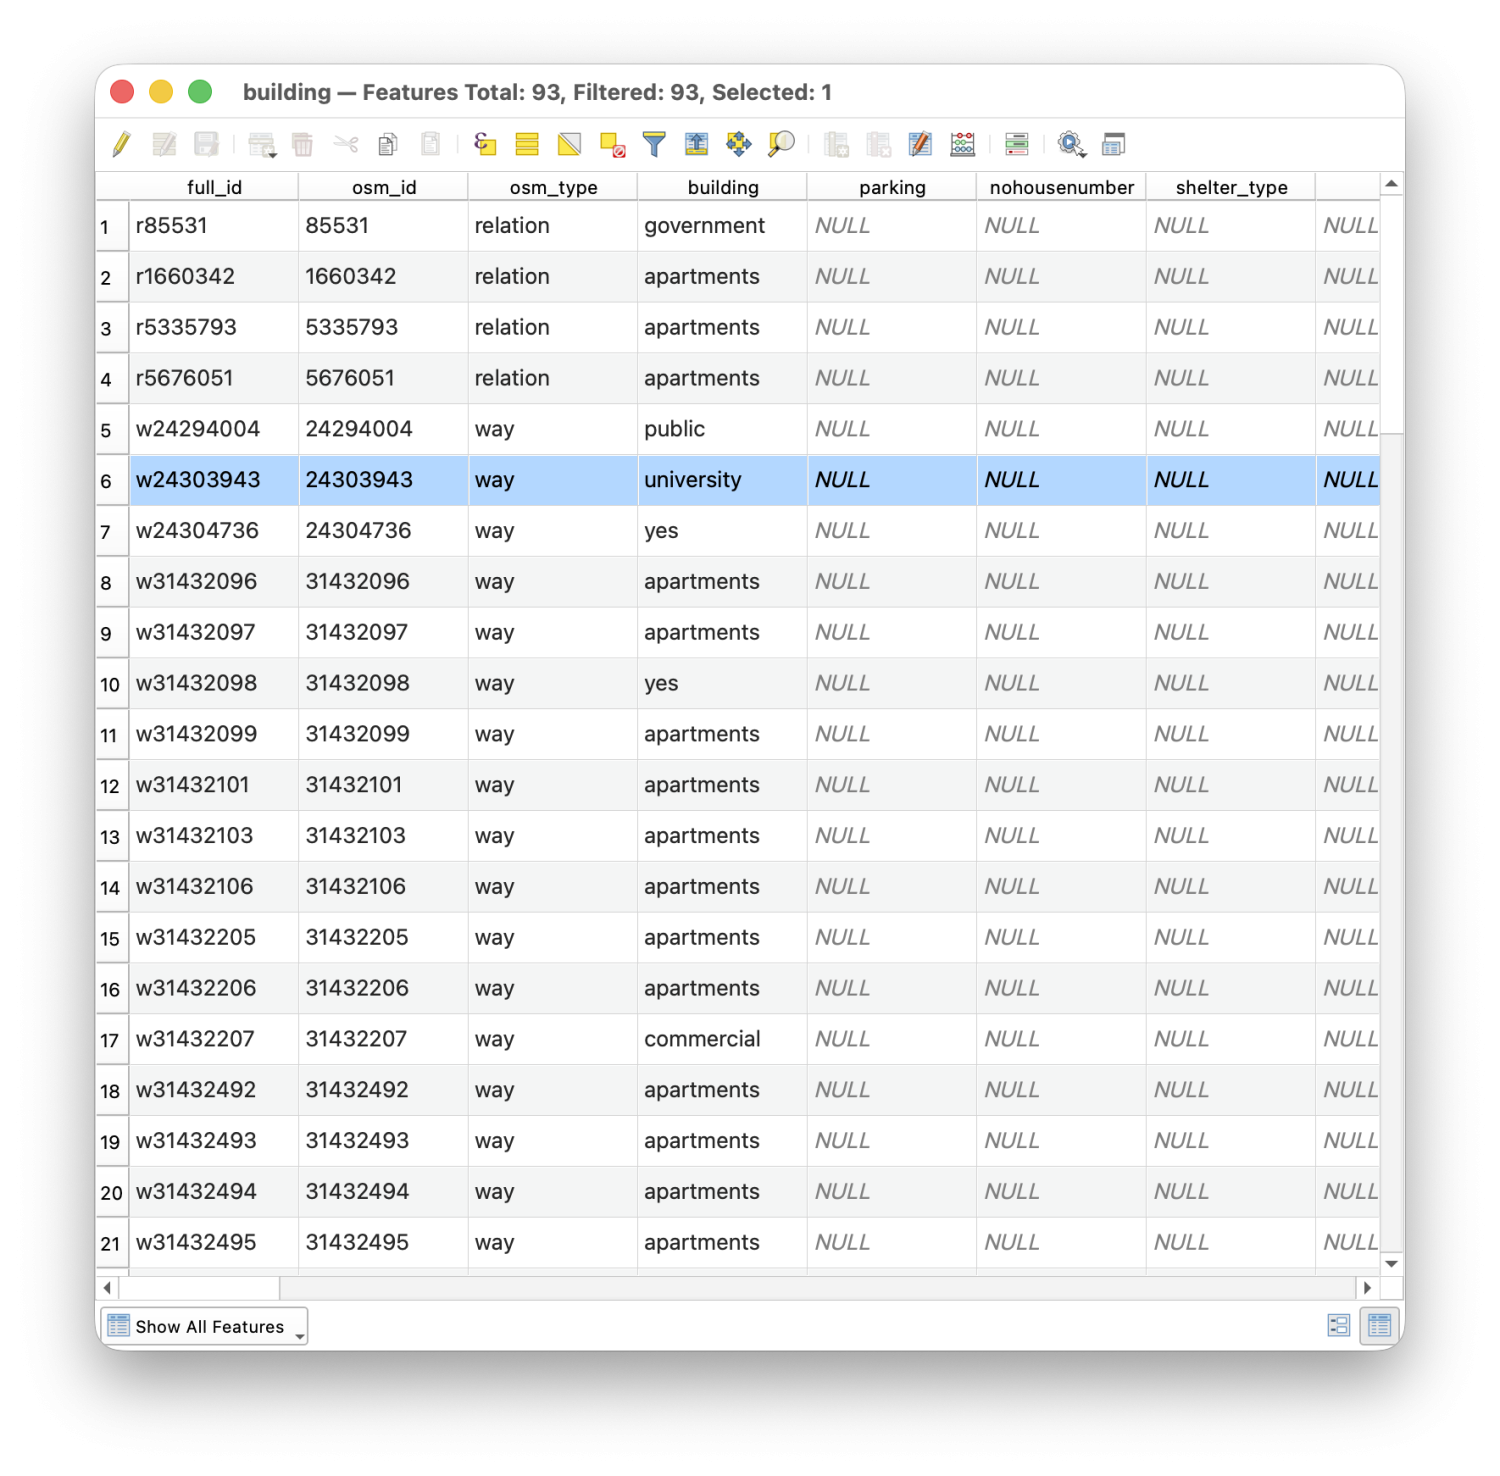
Geographic data is not only made up of geometric features such as points, lines, and polygons. It also includes attribute data, which describes additional information about each feature. This metadata can be accessed through the Attribute Table in QGIS. Each row in the table represents one geographic feature, while each column contains a specific attribute, such as a name, type, height or classification.
Styling
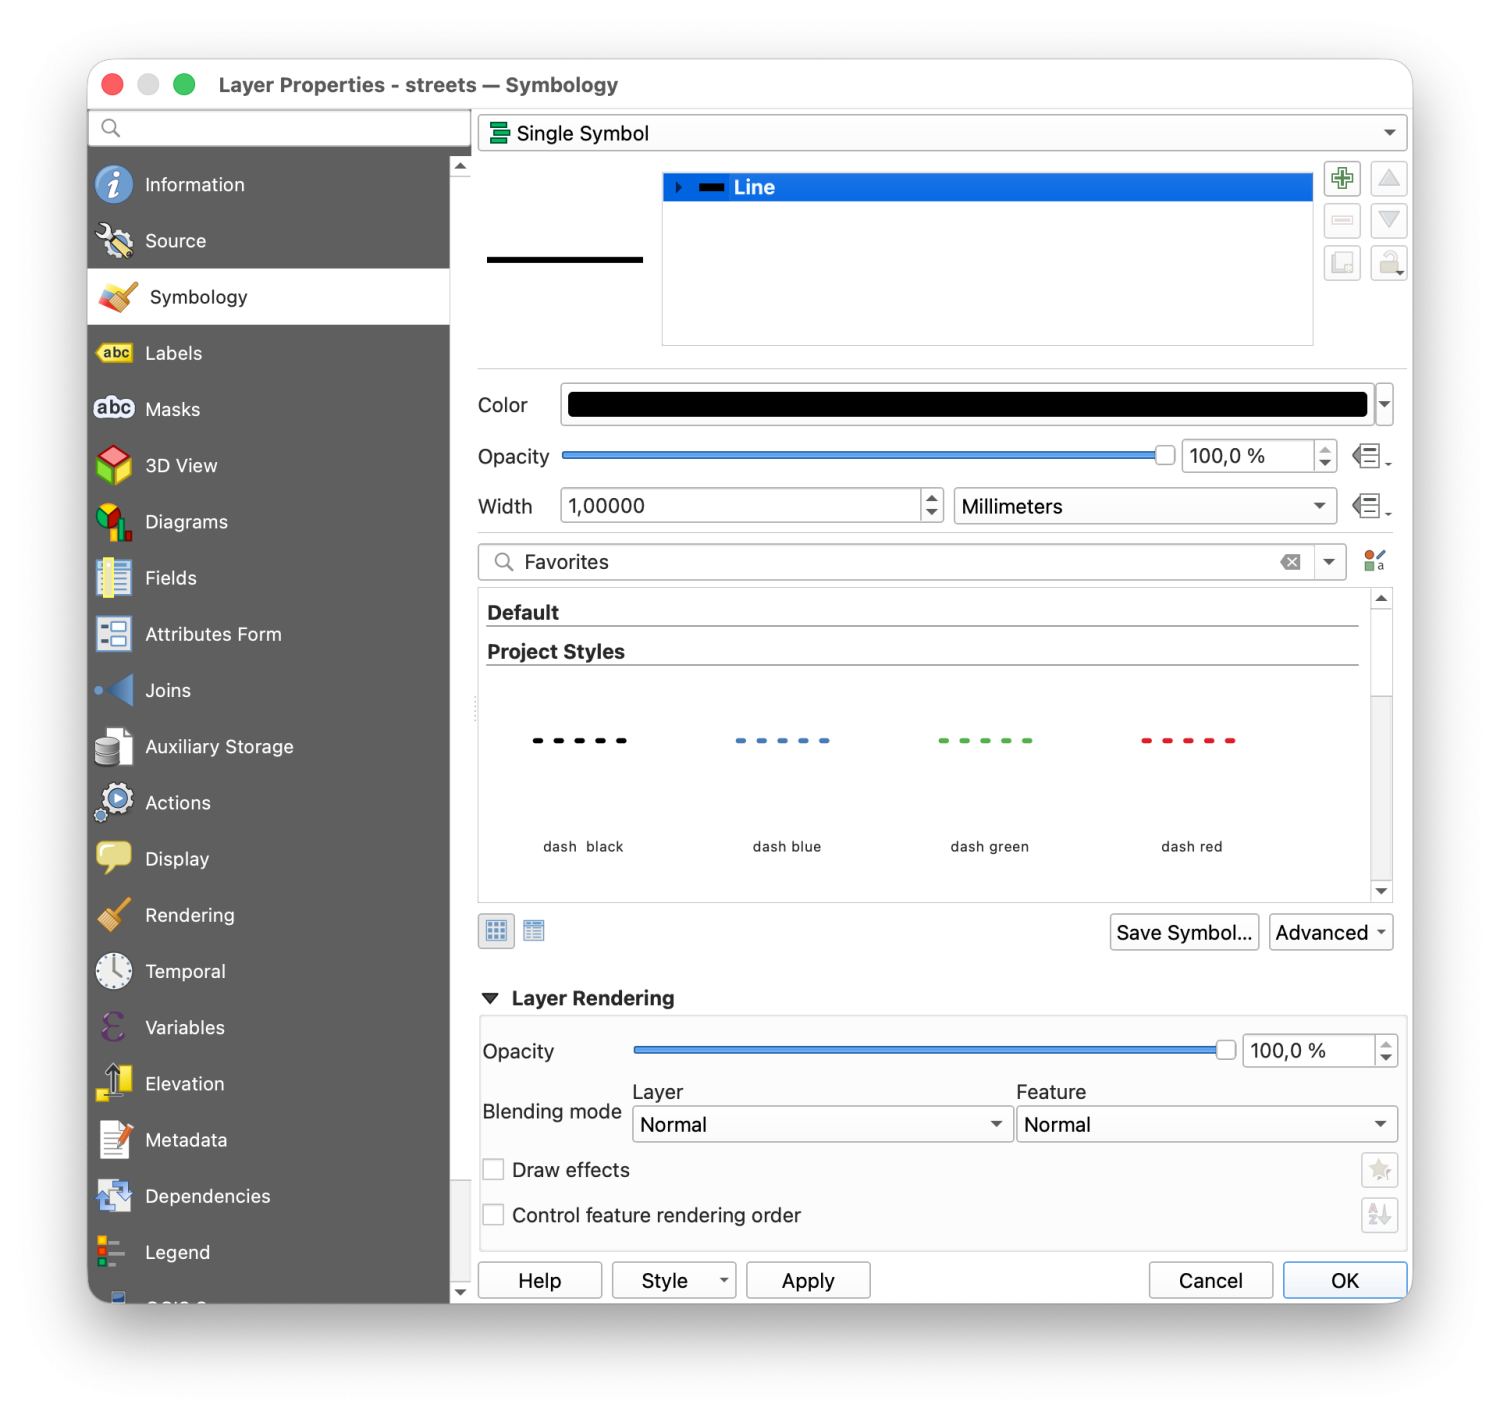
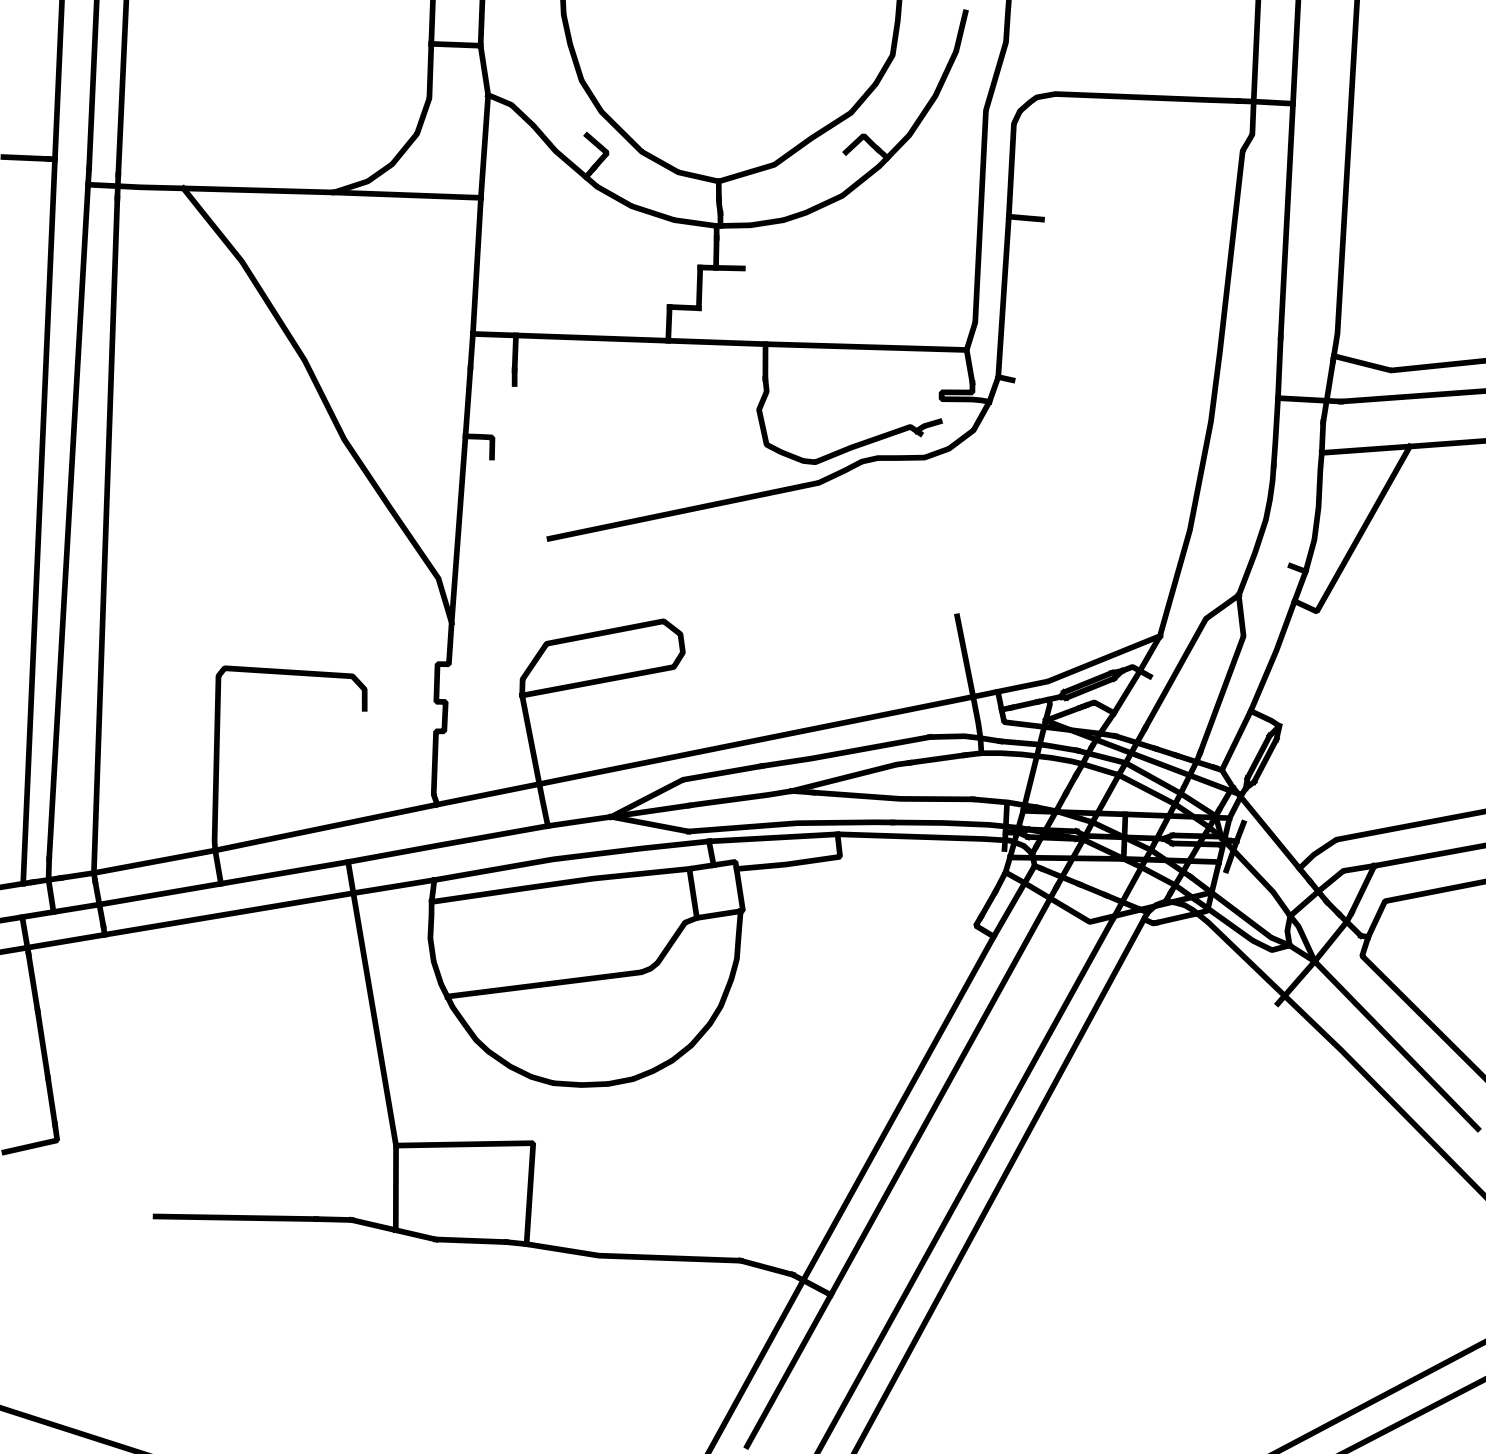
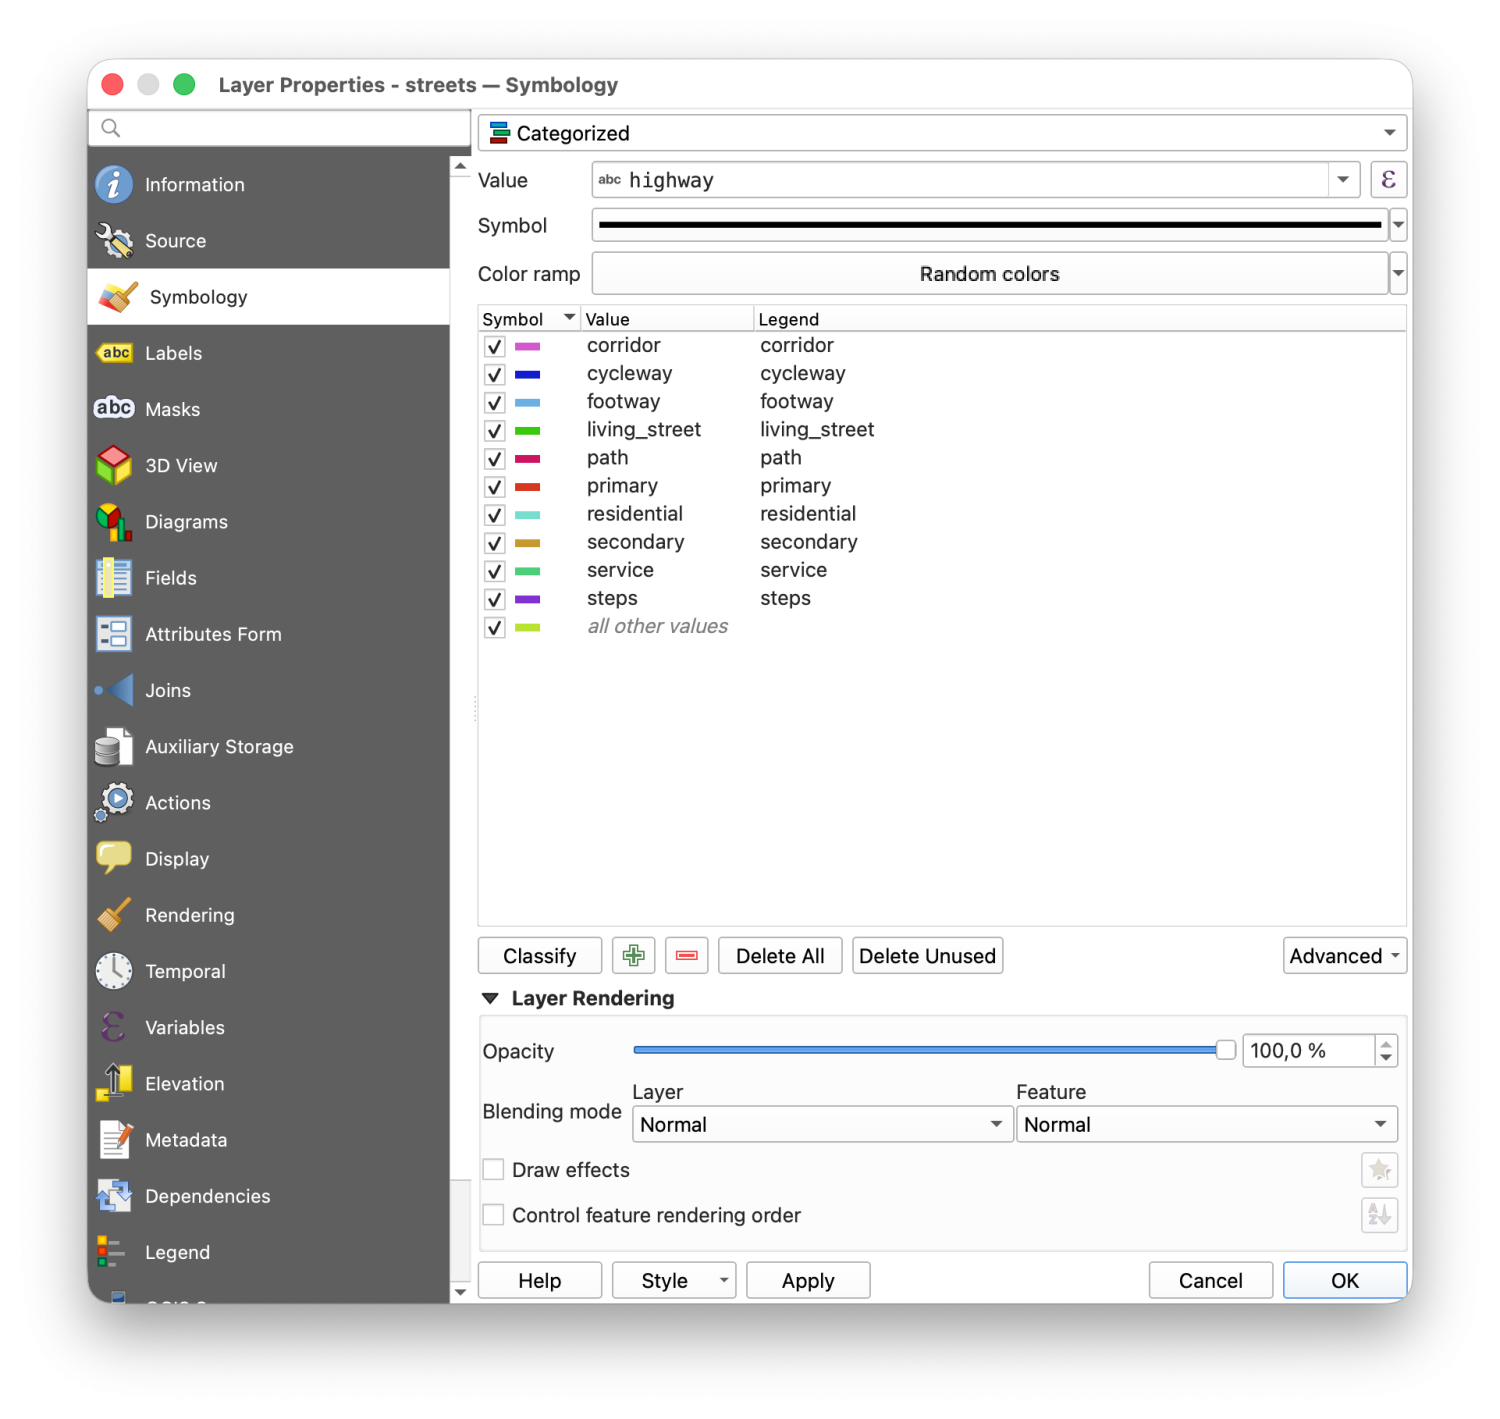
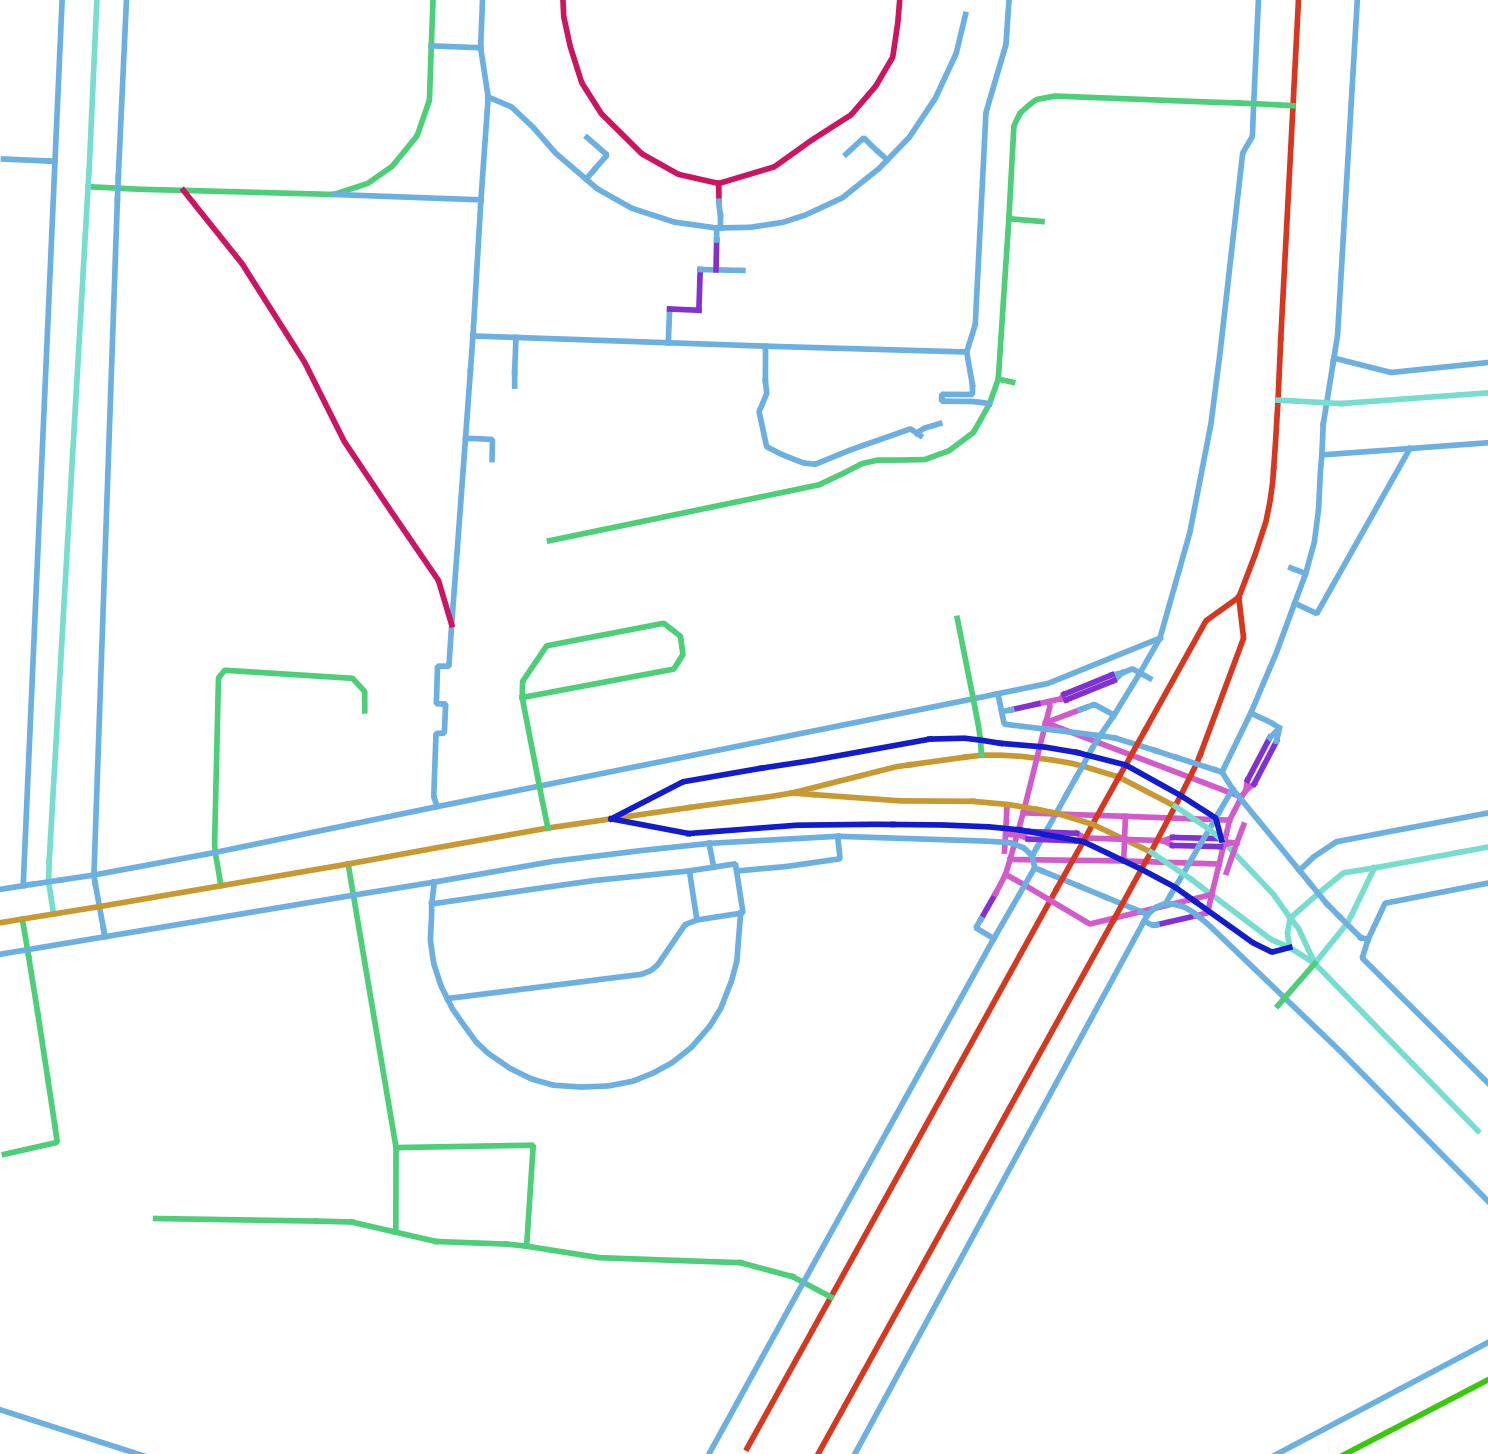
By double-clicking a layer, you open the Layer Properties panel. Under the Symbology tab, you can define how the layer is displayed. You can either style all features in a layer in the same way or create styles based on attribute values. For example, a street dataset can look quite complex at first. To make it more readable, different street types can be shown in different colors.
Instead of Single Symbol at the top, you can choose Categorized, Graduated, or Rule-based styling. These options allow you to select an attribute value that controls how features are differentiated visually.
Single Symbol
Categorized
Labels
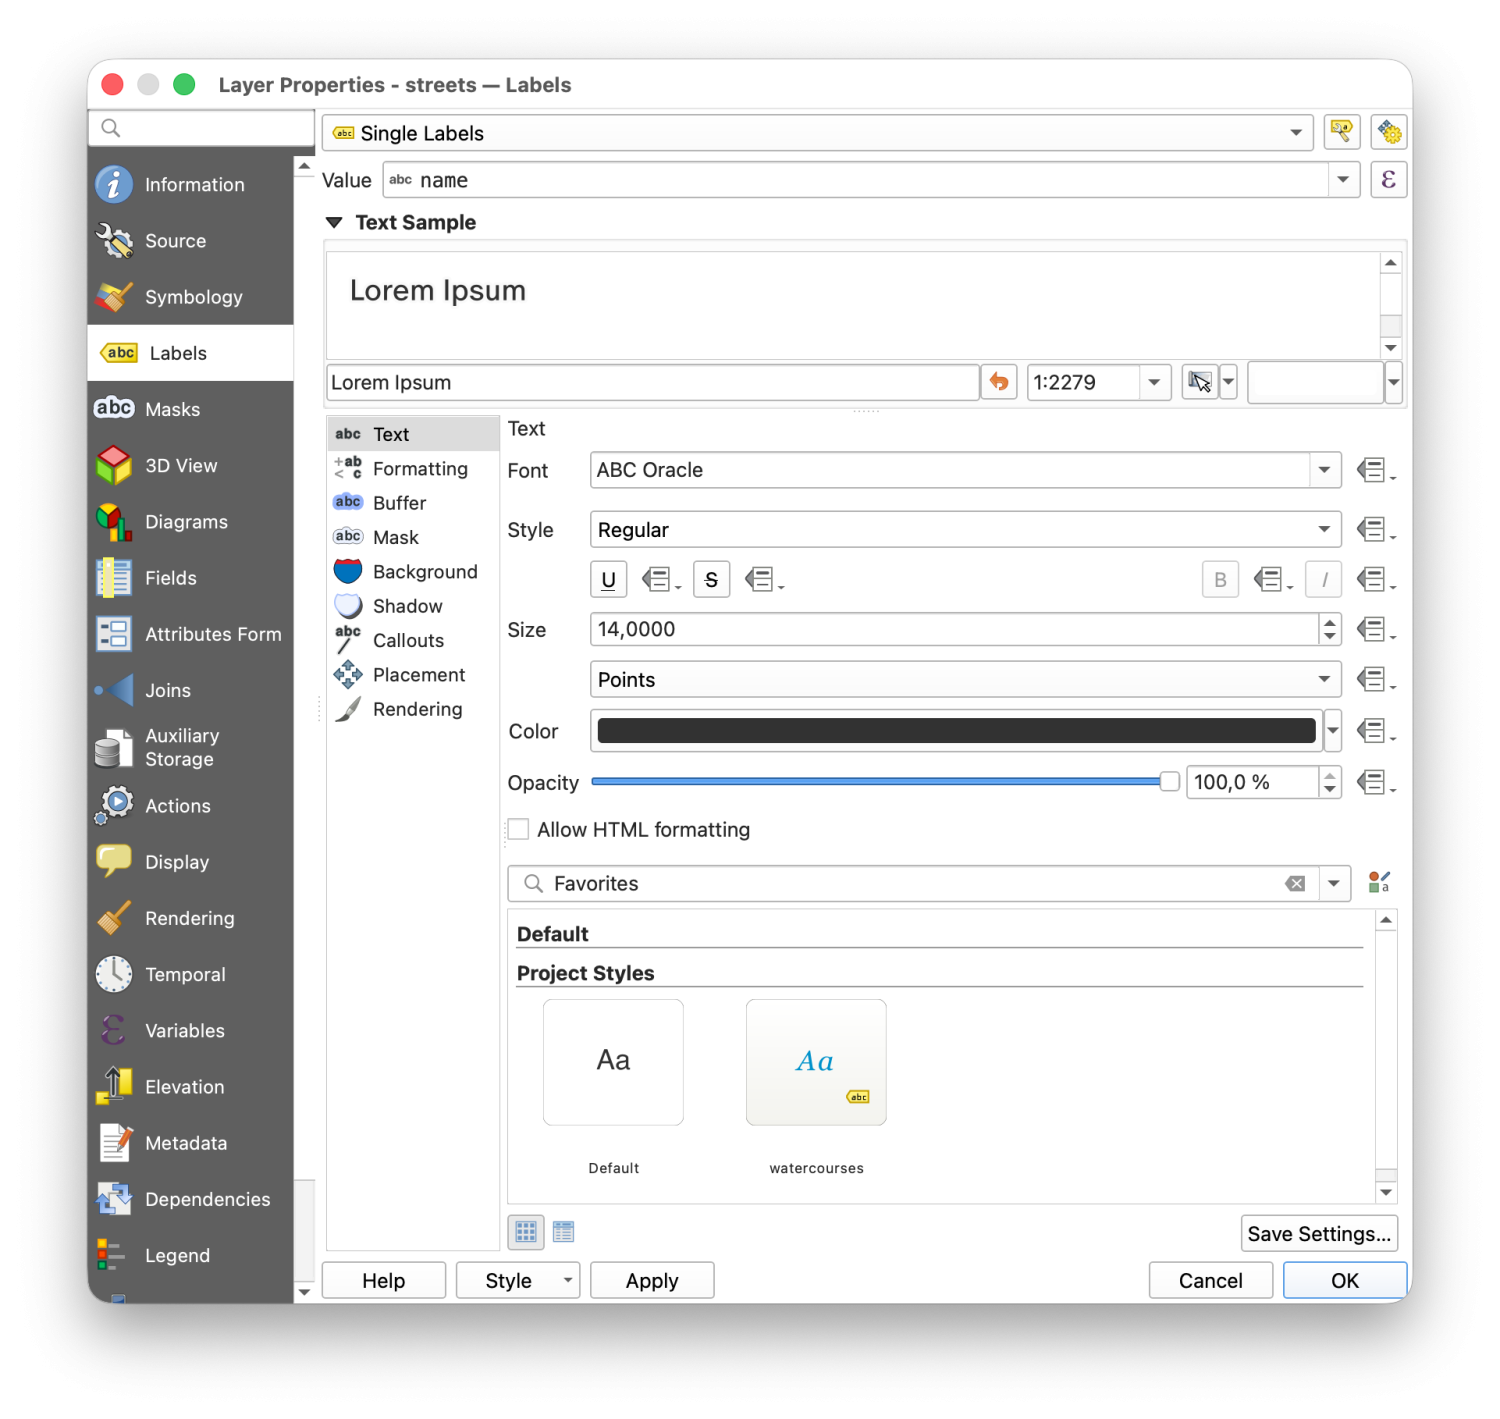
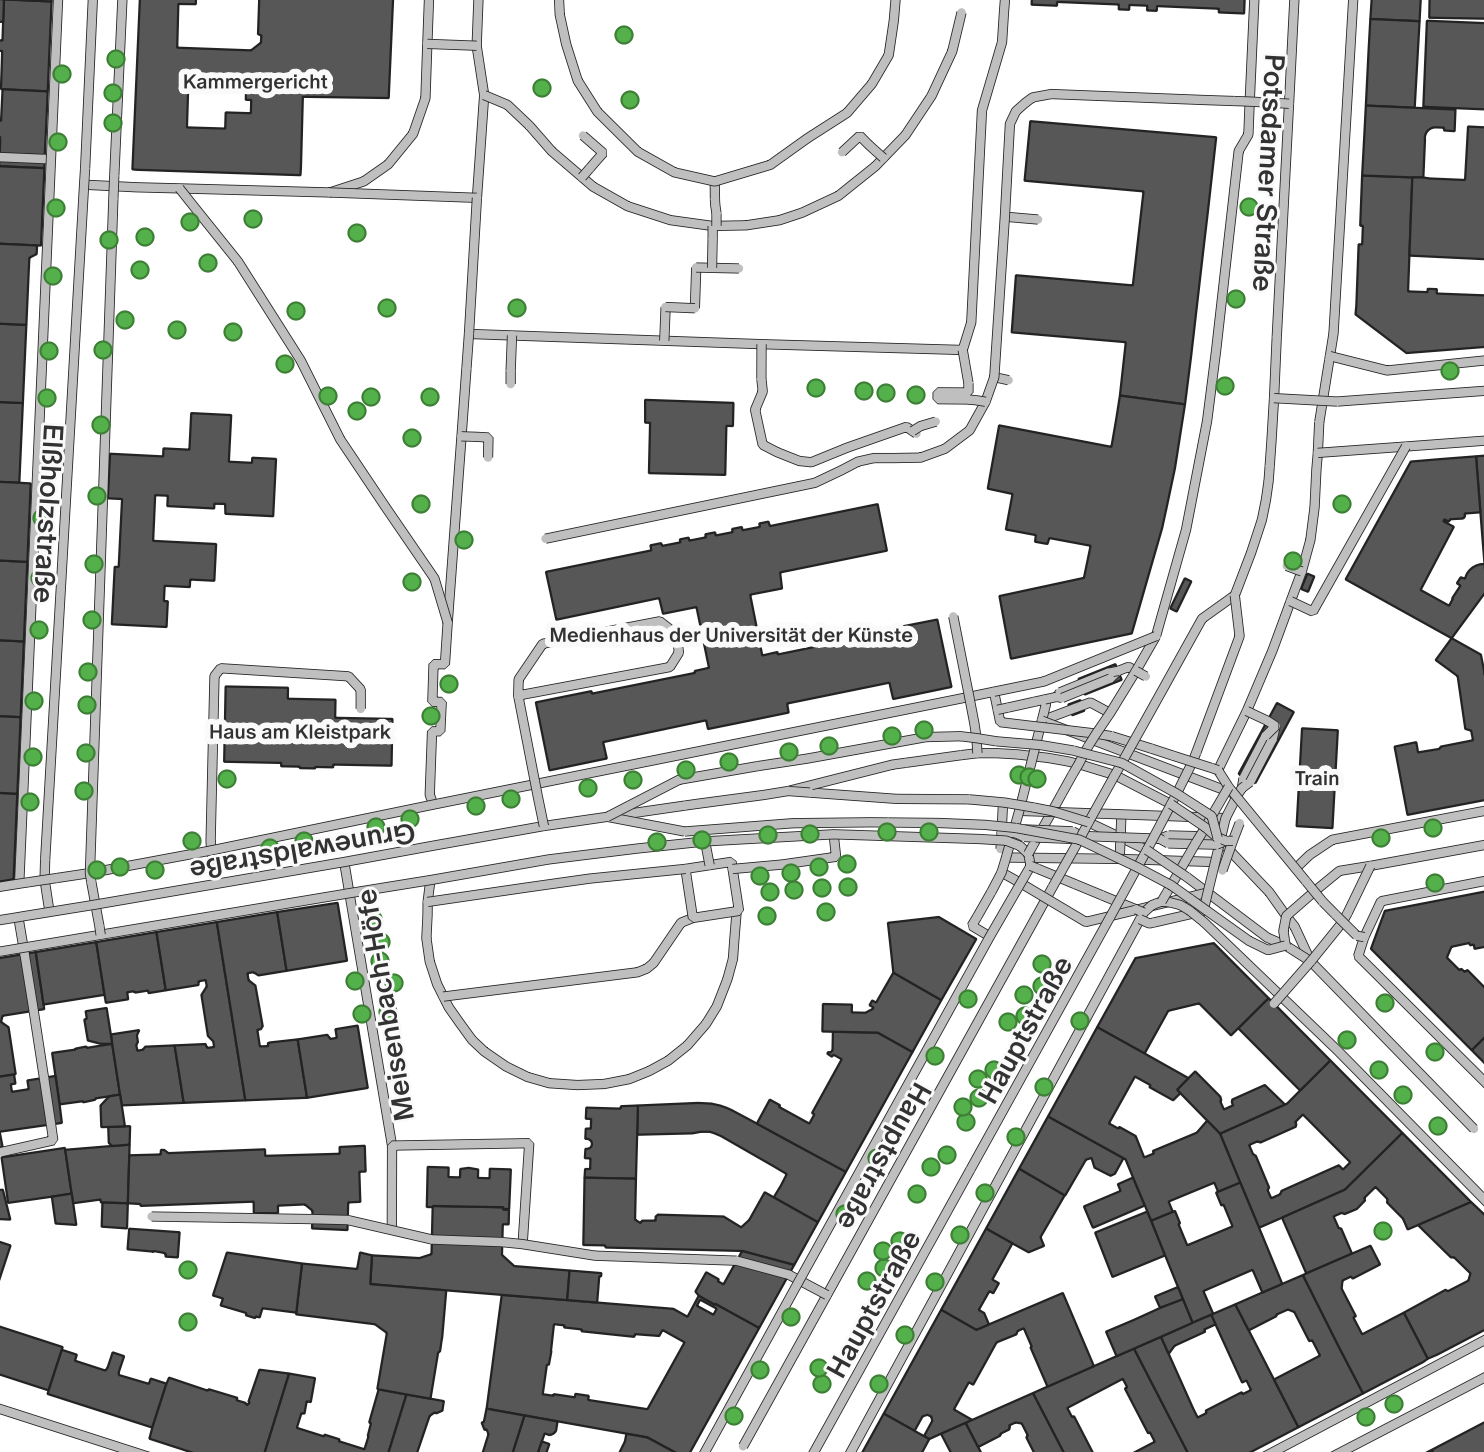
In the styling panel you can also add labels to your features. Select Single Labels you to display attribute values directly on the map, such as street names or building information.
Export
To export your map as a vector file for further editing in Adobe Illustrator, you need to use the Print Layout in QGIS:
Go to
Project→New Print Layout.Give the layout a name and click OK.
In the layout window, go to
Add Item→Add Mapand draw a frame on the canvas.Go to
Layout→Export as SVG.Choose a file name and save location.
Select
Always Export Text as Text Objectsto keep labels editable.Open the exported SVG file in Adobe Illustrator for further editing.
